
A Guide to Facebook Insights and How They Can Help Your Small Business

If you're a little disappointed with some lackluster results from your Facebook Page, there's a tool you can use to help you figure out what is working well with your followers so that you can build off of that. This tool is Facebook Insights. If you want your small business to be successful on Facebook, you need to know what's working well on your Facebook Business Page. In this article, we'll be going over what Facebook Insights are and how you can use it to the benefit of your business.
What are Facebook Insights?
Facebook Insights allow you to see in-depth information about your Facebook Page. They will give you info about your posts, how to study competitors, demographics, page likes, recommendations, and so much more.
To access the Facebook Insights tool, you need to have a Facebook Business Page. From your Business Page, you'll find the option for "Insights" along the left-side navigation bar.
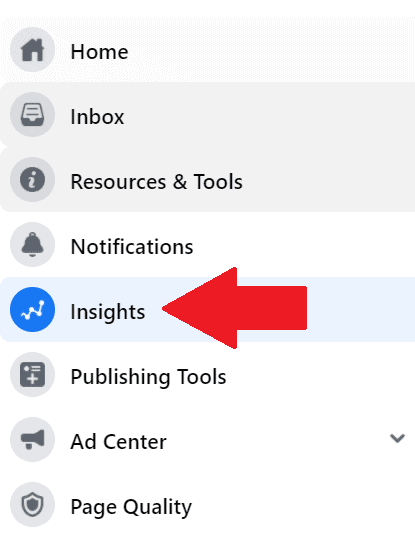
Once you click on "Insights," you'll be taken to an overview page, where you will see a range of additional options for other metrics. We'll be going over each of these options in our article.
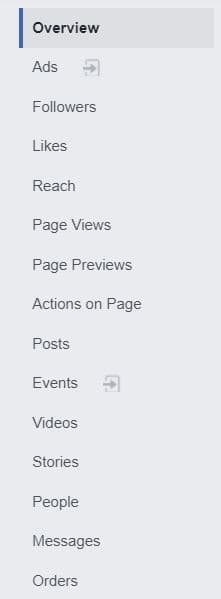
Overview
The Overview Page is the first thing you'll see when clicking on Facebook Insights. It basically contains a snapshot of what's happening on your Facebook Business Page.
Page Summary
The first section of this page is the Page Summary, which is made up of 12 boxes that give you highlights of a variety of metrics, including Page Views, Post Reach, and Responsiveness, just to name a few.
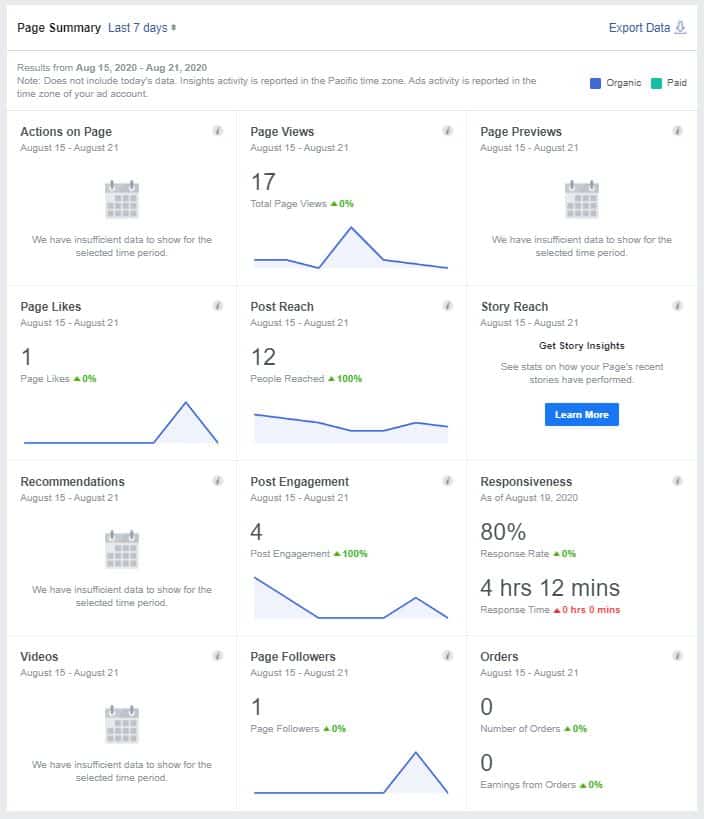
Some of the metrics shown in your Facebook Insights might be slightly different, depending on what you told Facebook your business does. As a default, the boxes will show metrics for the last seven days. However, you can select a different period using the dropdown next to "Page Summary."

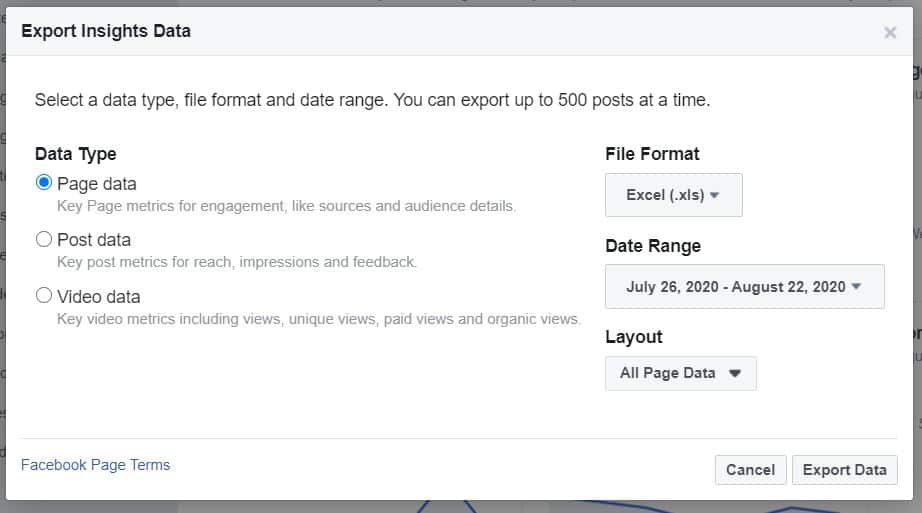
Expert Tip: Did you know that you can export your metrics? This is a great way to analyze your data even further. Use the "Export Data" button in the upper right corner.

Once you click on the "Export Data" button, you'll be able to choose the data type, file format, date range, and layout.
Recent Promotions
You used to be able to see your Recent Promotions on the Insights overview page. However, those have been moved to the "Ad Center," which you can find in the navigation menu on the left-hand side or by clicking on the blue "Visit Ad Center" button.

The Ad Center will show you details and results for your Page's most recent paid promotions. You can also create ads from this page.
Want to determine where your ad budget should go? Collect information from the Ad Center and use it to run two short ad campaigns. This way, you can determine which one works best and focus your efforts on what resonates better with your audience.
Your 5 Most Recent Posts
If you continue scrolling down the Overview Page, you'll find a section called "Your 5 Most Recent Posts." This section highlights information such as:
- When the post was published (date and time).
- The post caption. Clicking on this will bring up a pop-up that shows you the post's details.
- The type of post (Status, Link, Image, Video, etc.).
- The post's target. This will always be Global unless it's a paid ad.
- The post's reach (Organic / Paid).
- The amount of engagement the post received (Clicks, Reactions, Comments, and Shares).
- The option to promote your post.
You can use the statistics from the "Engagement" column to determine how to use your budget for paid social ads. You can pay to promote your most successful posts by clicking the blue "Boost Post" buttons.
Pages to Watch
The final section on the Overview page is "Pages to Watch." Here, you will find suggested Pages that are similar to yours so that you can compare the performance of your Page and posts.
You'll see information such as total page likes, percentage change up or down from last week, Posts This Week, and Engagement This Week. You'll see your own Business Page at the bottom of the list so you can easily compare the metrics.
Expert Tip: You can type the phrase "pages liked by people who like [insert your page name here]" into the main search bar. This will help you find other pages that your followers like, so you can add them to your "Pages to Watch" list.
Followers
On this page, you will find information about your Followers, which are the people who have chosen to follow your Page. Sometimes these people will Like your Page as well, but that doesn't always happen.
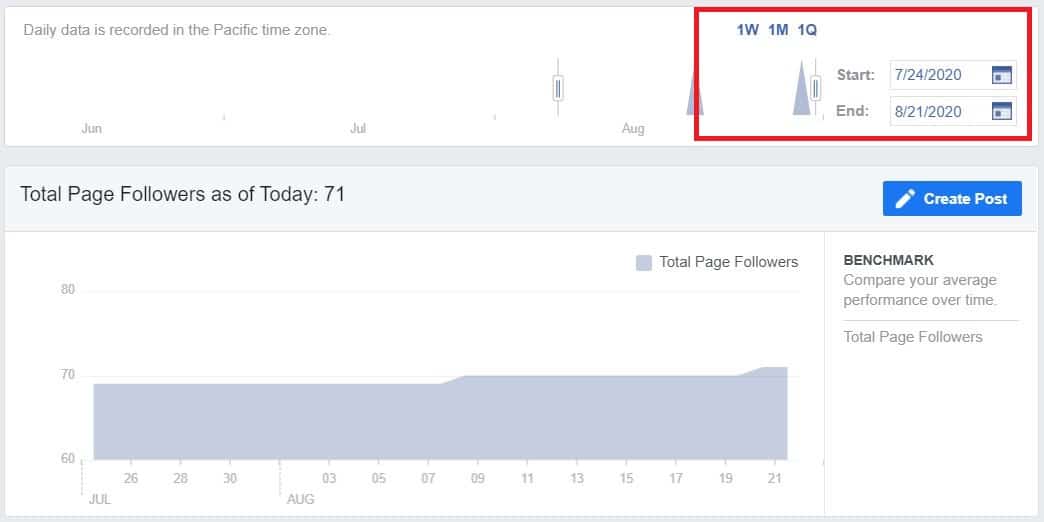
At the top of the Page, you will find a date range that allows you to select the last week, month quarter, or a specific range.
Total Page Followers as of Today
This section allows you to see how many followers you have for the date range you selected. This is helpful for comparing your average performance over time.
Page Followers
This section will tell you how many followers you have gained and lost. You will find Unfollows, Organic Followers gained, and Paid Followers gained. Paid Followers are ones that occur within a day of viewing your ad or 28 days of clicking on your ad.
You can also choose to promote your Page from here.
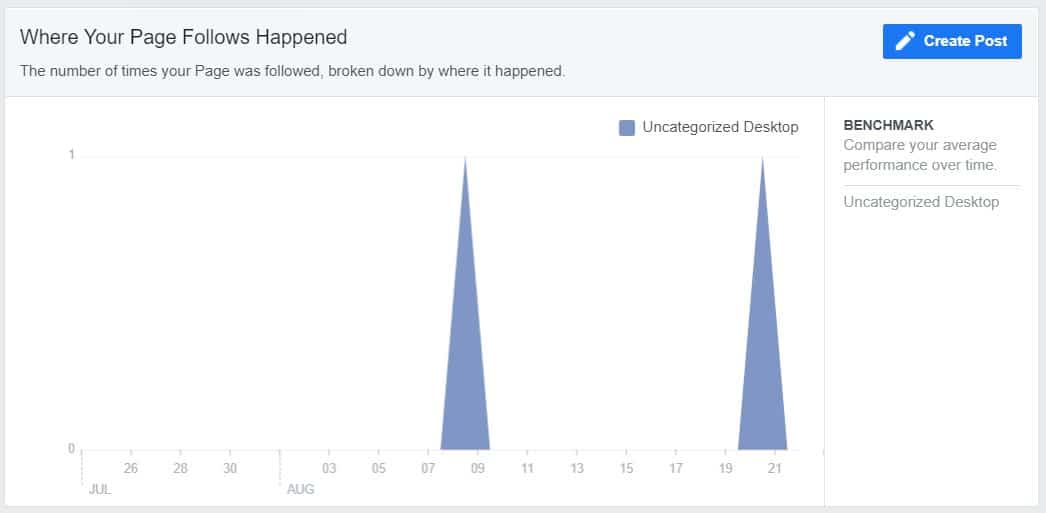
Where Your Page Follows Happened
This section will tell you how people are finding your Page.
Page Likes
Likes help you determine what your Page's successes and failures are. One way to understand your audience is by monitoring how many people Like your Page. Facebook Insights gives you highlights on how things are changing over time.
At the top of the page, you will find a date range, where you can choose to view the last week, month, quarter, or specific dates.
You'll also find three other sections here:
- Total Page Likes as of Today: This shows how your Page likes have changed over the selected period of time.
- Page Likes: This section shows you Unlikes, Organic Likes, and Paid Likes (which are the likes you receive from your paid ads). This is helpful when it comes to seeing where your Likes are coming from.
- Where Your Page Likes Happened: This shows you where the page was liked from (Page Suggestions, On Your Page, Uncategorized Desktop, Search, etc.). For example, a person may have liked your page after reading a post on it.
Page Reach
On this page, you'll gain insight into how many people are seeing your posts. Once again, at the top of the page, you'll find a date range where you can choose the dates you'd like to view. Under that are five sections:
- Post Reach: This is how many people have viewed your post (Paid and Organically).
- Recommendations: This section will show when people recommended your Page in comments and posts. Make sure you fill in your contact information and location details on your Facebook Business Page. This way, when your business is recommended, these details will show up.
- Likes, Comments, and Shares: This chart will display the types of engagement people had with your page during the selected time period. These are good actions that can help you reach more people!
Expert Tip: You can click or drag on the Likes, Comments, and Shares chart to view the posts that were published during that period. This will help you determine what worked well and what didn't.
- Hide, Report as Spam, and Unlikes: These are the kinds of reactions you want to avoid since each one will decrease the number of people you reach. The most common reasons people "unlike" something include posting too frequently, uninteresting content, and posting content that is repetitive.
- Hide: When someone hides your Page, it means that people don't want to see the content, but they still like your Page.
- Unlike: This is when people remove their Like of the Page.
- Total Reach: This chart will show you the number of people who saw content from your Page. This includes posts made by you, posts to your Page by other people, mentions, check-ins, and more.
Here are some things that impact organic reach:
- When you posted the content, such as the time of day and day of the week.
- Your content's engagement, such as likes, comments, and shares.
- The type of content. Some of the most favorable content includes things that are popular, trending, or time-sensitive.
Page Views
The purpose of your Facebook Business Page is to attract visitors. The information from the Page Views Insight will tell you how many people have seen your Business Page in the selected time period. There are three sections here:
- Total Views: This is the number of views your Page has had in the selected time period. You can also break this data down by section. This will help you figure out which parts of your Page are the most popular so that you can focus your efforts there.
- Total People Who Viewed: This graph can break down your Page views by section, age & gender, country, city, and device. You can use this data to see who is actually consuming your Facebook content and whether it is reaching your intended audience.
- Top Sources: This graph will show you where people are coming to your Page from, whether it's from Facebook or another site.
Page Previews
This Insight is similar to Page Views; however, it focuses on the people who have previewed your Page. While there isn't as much targeting here, you can change the date range, and view by age and gender.
Actions on Page
Content and promotions are bringing people to your Page, which is where you want them to perform specific actions, such as visiting your website, getting directions, or contacting you. Here you will find five charts (based on the types of actions you choose to show):
- Total Actions on Page: The information you'll find here is based on the type of actions you choose to show. Some of these options include website clicks, phone number clicks, or action button clicks. This chart will show how many of each of these actions have been taken.
- People Who Clicked Action Button: This chart will break down the people who click your action buttons by age & gender, country, city, and device. You can experiment with different CTAs to see which one works best for your business. Some examples of CTAs include: Book Now, Learn More, and Shop Now.
- People Who Clicked Get Directions: This chart will break down the people who click your Get Directions button by demographic.
- People Who Clicked Phone Number: This chart will break down the people who click on your phone number button by demographic.
- People Who Clicked Website: This chart will break down the people who click on your website link by demographic.
Posts
Publish posts to help bring people to your Page, get them to Like it, and keep them engaged with your brand. This Facebook Insight will help you learn more about your posts and how people are reacting to them. It is broken up into two sections. The first section highlights three sets of data:
- When Your Fans Are Online: This chart shows you when your fans tend to be online. It will sort them by days of the week and hours of the day in whatever your computer's local timezone is.
Expert Tip: If you find that your target audience is online during times you are unable to post, don't fret! Learn how to schedule your Facebook posts without 3rd party applications.
- Post Type: This chart filters your posts into types, then shows you the average reach and engagement for each type. Types of posts include: Video, Shared Video, Status, Link, and Photo. If you want to maximize your reach and engagement, you can use this chart to figure out which type of post works best for your business, then focus the majority of your efforts there.
- Top Posts from Pages You Watch: This chart will show you the engagement levels of posts from the Pages you've selected to watch.
The second section is "All Posts Published." Here you will find information on every post you've published in the selected time period, along with details on reach and engagement. You can sort the columns to get a better view of which posts have had the most success.
Videos
If you've been adding videos to your Page, this is where you can view information about your video content. There is also a section if you have paid video ads.
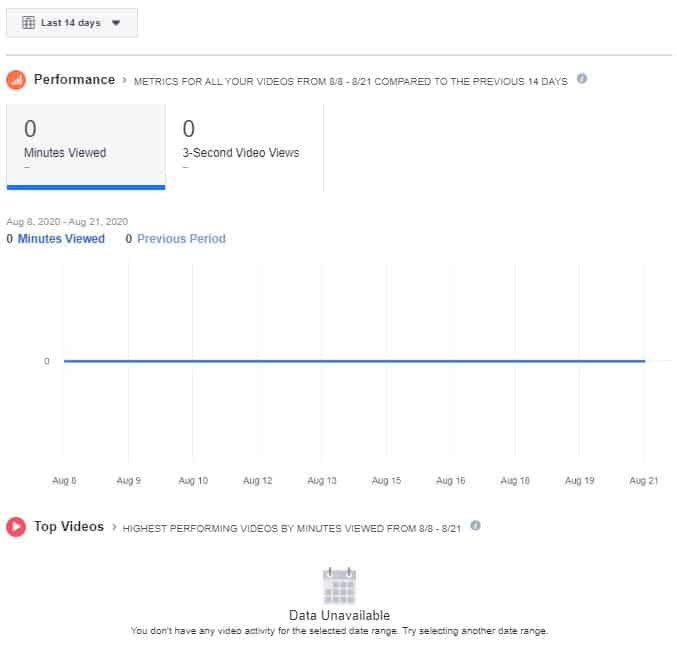
Here you can see the performance of your videos, including the minutes viewed, and 3-second video views. Under this chart, you'll be able to see your top-performing videos.
Helpful Article:
Stories
Click on this Facebook Insight to learn more about the Stories you've created in the last 28 days, even though these stories disappear after 24 hours.
Groups
This Insight option will show up if you have a Facebook Group that you've linked your Page to. From here, you can see some basic information about the Groups tab.
In the first graph, you can see members, posts, comments, and reactions. The second graph breaks down the Group's members by demographics. You can change the specified time period and create posts for the Group right from this page.
People
This Insight is excellent for understanding who your audience is and some more in-depth information about them. People will be broken down into three sections: Your Fans, Followers, and People Reached.
For each of these sections, you'll see the breakdown of gender ratio, age groups, country, city, and language.
- Your Fans: These are the people who have Liked your Page.
- Your Followers: These are the people who have Followed your Page but have not Liked it.
- People Reached: These are the people your content has reached. The people you see in this section are more than just those who Like and/or Follow your Page. You can compare and contrast this data to see who you are actually reaching.
Messages
If people are engaging with your Page, there's probably a chance some of them will use the messaging functionality to get in touch with you. You can keep track of how you are dealing with them here as well. You can view data such as messaging connections, block rate, responsiveness, and new connections.
Consider displaying your response rate to let people know when they can expect to hear from you. You can find this option in the Facebook Settings > Messaging.
Orders
If you're an e-commerce business that is able to sell through your Facebook Page, this Insight will tell you the number of orders made via your Page for the selected date range.
IMAGE
Helpful Article:
Using Facebook Insights
Facebook Insights provide you with a lot of information, but how do you use all of these details to fine-tune your marketing strategy? Here are a few ways you can use Facebook Insights:
Download and Store Your Data
Having the data in Facebook Insights is good. Still, you can also download it into a spreadsheet to further study it. You can download different data types, such as page data, post data, and video data. You can further customize your export by selecting the file format, date range, and layout.
Study Pattern Changes
In order to see what works best for your business, you need to try different things. Every time you try a new type of strategy, post, or video, you want to know what kind of impact it has on the reach of your Page.
Head to the "Reach" Facebook Insight to study spikes and look for pattern changes. You can also see if people are unliking or unfollowing your Page with the introduction of this new content.
Figure Out Which Posts Perform Best
It's a good idea to focus your efforts on the content that works well. Studying the "Post" Facebook Insights can show you your top-performing content. You can view your posts by reach, engagement, and negative reactions. This will help you figure out what kind of content your audience likes and what they don't like.
Takeaway
Facebook Insights is a valuable tool that comes free with every Facebook Business Page. These insights provide a ton of information that is definitely worth studying if you want your Page to deliver a return on investment. However, what works for one business might not work for another. Use the tips listed in this guide to help your small business be successful on Facebook!